One of our clients operates on a somewhat unique fiscal year; June 1st to May 31st. They asked us to create a Tableau dashboard widget that displayed product revenue for the current fiscal year (“This Fiscal”) with a year-over-year comparison to the last fiscal year (“Last Fiscal”). Through a tedious trial and error process, we discovered the best way to create the widget was to use a Tableau calculated field with a simple DATEADD formula.
The DATEADD function first appeared as an Excel VBA function sometime late last century (how old does that make you feel?). It allowed you to add or subtract days, months or years from a given date. The Tableau version works in the exact same way:
DATEADD("YEAR",5,[Date]) // Adds 5 years to the specified date
DATEADD("MONTH",-5,[Date]) // Subtracts 5 months from the specified date
DATEADD("DAY",14, TODAY) // Adds 2 weeks to today’s date
The tricky part was making the formula dynamic so that we didn’t have to rewrite the formula every new fiscal year. Here’s what we came up with:
IF YEAR(DATEADD("month",-5,[Date])) == YEAR(DATEADD("month",-5,TODAY()))
THEN "This Fiscal"
ELSEIF YEAR(DATEADD("month",-5,[Date])) == YEAR(DATEADD("month",-5,TODAY()))-1
THEN "Last Fiscal"
ELSE "Unknown Fiscal" END
In plain English, this says “Subtract 5 months from the data’s month, and then subtract 5 months from today’s month. If the years are the same after you do that, then label the date as “This Fiscal” year.
Example
For example, imagine that today is March 12, 2017, and you are trying to determine whether two rows of data are “this fiscal year” vs. “last fiscal year”. Imagine that the two rows of data have a [Date] of February 12, 2017 and May 16, 2016, respectively
Subtracting five months from today’s date yields some day in October, 2016 (March 12, 2017 minus five months = some day in October, 2016). We are only interested in the 2016 part…in other words, the ‘fiscal-corrected year’ is 2016. Subtracting five months from the first row of data gives us some day in September, 2016 (February 12, 2017 minus five months = some day in September 2016). Again, we are only interested in the 2016 part. For the second row, subtracting five months gives us December, 2015 (May 16, 2016 minus five months = some day in December 2015). The first row is in the same fiscal year as today, because we subtracted five months from it’s date and five months from today’s date, and they are in the same year (2016). The second row is in a different fiscal year as today, because we subtracted five months from it’s date and five months from today’s date, and they are in a different year (2015 vs. 2016).

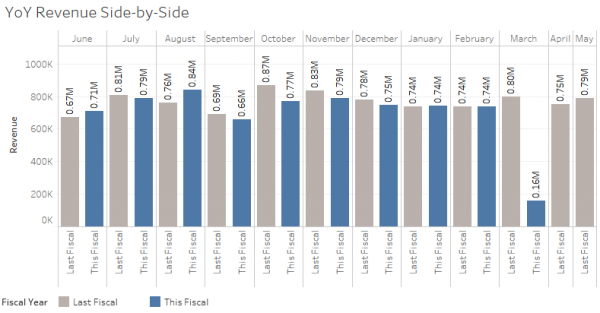
And here’s our end result:
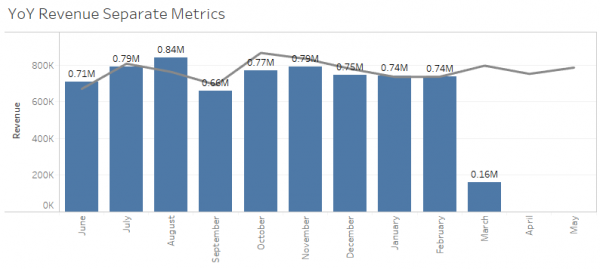
Or, if you want to show “last fiscal year” as a line graph, and “this fiscal year” as a bar chart, you can create separate calculated fields for each metric. One calculated field would be “Revenue This Fiscal” and the other would be “Revenue Last Fiscal”, and you could create a chart like this:
Click here to download the Tableau packaged workbook we used to generate these year-over-year graphs with an arbitrary fiscal year.
By Todd Gamber · February 4, 2019
← All Posts