
Differences from GA3 and how to interpret reports
Introduction:
With the switch to GA4, many clients come to us for guidance on how to compare their GA3 (Universal Analytics) data to GA4 and what differences may indicate, if anything. There are many reasons as to why you may see disparate data, from concept (GA4 uses an event-based model, while GA3 was session-based) to implementation (the dataLayer and tag structure are both updated with GA4). Note that this also applies to GA4 vs other analytics tools like Shopify or Heap, which tend to act more similarly to GA3. Some of these differences are easily explained away or small enough to be insignificant and acceptable. On the other hand, some differences in the data are a true cause for concern, due to the degree of the difference and/or the impact on KPIs and the business’s bottom line.
One critical data piece for any online retailer using GA is revenue. Overall revenue should be identical between GA3 and GA4, and differences should be urgently and critically looked at. If revenue data appears incorrect, a first place to check is to ensure that your tags pull the total revenue from the correct variables in the dataLayer; one total may include tax while the other does not, for example.
Once revenue collection is validated, this becomes the key metric by which to evaluate performance. For most businesses, a deep understanding of converting traffic is critical to driving customer acquisition and sales or other conversions.
Do you need help validating your e-commerce sales and revenue tracking in GA4? Contact us today for a consultation!
Background
Ok, so now you have your revenue collection validated, and you’re ready to dive into your GA4 reports.
The GA3 and GA4 data models will start to come into play when comparing revenue by channel. Remember, GA3 was session-based and had multiple hit types, while GA4 is event-based and all types of hits are simply considered ‘events’. Additionally, they count sessions differently.
| Difference | GA4 | GA3/ Universal Analytics/ Most other tools |
| Session duration and timeout | GA4 calculates the duration of the session as the time between the first and last events of the session. | All sessions expire if there is 30 minutes or more of inactivity (unless the setting is changed in the View/Property) |
| Session starts | GA4 does not automatically collect page views, and does not require that sessions begin with the page view as the first hit. Referral and page information can be collected via other event tags, such as user_engagement. All hits are events in GA4, including page views. | In GA3, a session can end, and a new one begins while a user continuously uses the website in certain cases: Session spans midnight, 30+ mins of inactivity in between hits, A new campaign, referrer or source is introduced |
| Session ends | In GA3, a session can end, and a new one begins while a user continuously uses the website in certain cases: Session spans midnight, 30+ mins of inactivity in between hits, A new campaign, referrer, or source is introduced | In GA4, sessions are less vulnerable to arbitrary severing. A new referrer, a session spanning midnight, or over 30 minutes of activity will not cause a session to end. |
These data modeling differences affect the way these platforms will count sessions and conversions, especially when using multi-dimensional breakdowns.
One area where GA3 and GA4 will often report more disparate revenue figures is in revenue by channel, especially when looking at Affiliates.
Online retailing affiliates are companies that promote online retail sales for other companies or brands, and receive commissions for sales that are associated with their referral links. Understanding the power of affiliates, either as networks or individually, is critical to the revenue-driving strategy of any sophisticated online retailer.
So, if you see dramatically different figures for the revenue attributed to your affiliates channel in GA3 vs GA4, it is certainly cause for concern!
A Quick Scenario:
Henry’s Hats is an online retailer of a range of head apparel. They recently made the transition to GA4 and hadn’t really used the platform until GA3 sunset in summer 2023. They had put some effort into ensuring that their GA4 e-commerce was properly implemented and had verified that GA4 was collecting sales data accurately. Various data sources showed the same revenue figure as GA4 did. However, when Henry’s Hats looked at their affiliate revenue, it was about half of what they were used to seeing for affiliates in GA3. The total revenue for the time period is right, but the channel revenue attribution did not agree with their usual trends. So, what gives?
Remember that affiliates are companies that refer sales to other companies via online links. For Henry’s Hats and many other online retailers, some common affiliates that show up in GA are those that work as browser extensions, such as Honey or Microsoft Shopping. These affiliates work by popping up when the user is browsing an online retailing website, especially once they have added an item to their cart and are moving through the purchase flow. A user will often click on a little pop-up box, and a promo code or coupon is applied during checkout.
This click to apply the coupon code introduces a new referrer to the user’s session. UTM codes are injected and captured by GA, even though you likely won’t see any changes in the URL bar.
This action highlights a key difference between GA4 and GA3 (and most other analytics tools for online retailing/sales): GA4 does not start a new session if a new referrer is introduced, while GA3 and most other tools will. Because affiliate traffic acts in a particular way of getting introduced once a user is already on a website and likely entered into the purchase funnel, affiliate channel metrics are very different in GA4’s Standard reports.
In-depth Example:
Let’s consider an example case that reflects an increasingly common online purchase behavior: Applying coupons via a browser extension.
Billy has been feeling something is missing from his life and is considering becoming a “hat guy”. He enters a search for “snazzy hats for cool guys” into Google search, and clicks on an unsponsored link to the Henry’s Hats website. Billy browses for a while and eventually puts a $60 blue cowboy hat into his cart. The cost is a bit higher than he was hoping, so he clicks on his Honey browser extension to check if there may be any promo codes available for him to use. Honey finds a 15% off coupon, and Billy clicks the button to apply it to the purchase. The code is accepted by Henry’s Hats, and Billy completes the purchase for $51.
Summary: Google organic search link entry > Landing page page_view event > Product list view event > Product page page_view event, view_item event > add_to_cart event (Product price: $60) > view_cart event > Click on affiliate pop-up link (Honey) > Add payment details > Purchase event ($51 revenue) > Purchase confirmation page > Exits site
When Henry’s Hats’ data team looks at this purchase in GA, what do you think they will see in terms of attribution?
The answer depends on exactly how the report is configured and which report is used.
Analysis and Learnings:
In the Standard GA4 reports, you can look at the Acquisition reports to see various metrics by traffic source, including conversions and event counts, and revenue. You can also look at the Events or Conversions reports and add the traffic sources as a secondary dimension. Either way, you must be cognizant of what the dimensions you use mean.
Dimensions starting with “First user” are those that are populated by only the individual user’s very first visit to your site or app. These are user-scoped reports, and the user’s first user dimension values will have only one possible value and will never change for that user.
Alternatively, dimensions starting with “Session” are those that apply to a particular session or visit to the website or app. These will have one value per session, and these will be the traffic sources that brought a user to your site or app at that particular time (rather than just the very first time). The Traffic acquisition report uses session-based dimensions, which are often likened to “last touch” attribution.
Consider our example above. If Billy were visiting Henry’s Hats for the very first time, his first user channel would be Organic Search, and his session channel for that visit would also be Organic Search. If he comes back to the site a day later to look at more hats but comes from a link in an email, his first user channel will still be Organic Search, but his session channel on day two will be Email.
First user reports are helpful to understand the value of traffic sources in bringing new users to the site. Session reports show data for individual visits to the site, which is helpful to understand what source drove the user to the site on a specific session, and can illuminate trends with returning users, conversion paths, and traffic at certain times. Session reports will generally be the closest to GA3, since it didn’t have first-user reports and used last-touch attribution by default.
Seems pretty simple, right?
Well, to complicate things somewhat, in GA4, you can also create custom reports in the Explorations sections. These reports can be super useful in answering specific questions that standard reports cannot, and to perform investigations and analysis. However, sometimes it isn’t obvious which dimension or metric you should use when putting together your own reports from scratch, as many have similar names and meanings, such as “Purchase revenue” vs “Total revenue”.
If Henry’s Hats’ data team wanted to get information about a particular purchase rather than site-wide trends, they would likely use an Exploration rather than a Standard report.
If we filter the report to just Billy’s transaction ID, we will see different answers for traffic attribution depending on the dimension we use:
If we use Source (just “Source” – no additional prefix), we see both Google and Honey Science Corporation, with Honey getting 2/3s of the revenue attribution, and Google getting 1/3. Alternatively, if we use “Session source”, we see only Google. There is a total of one session and one conversion worth $51 in total Purchase revenue either way.
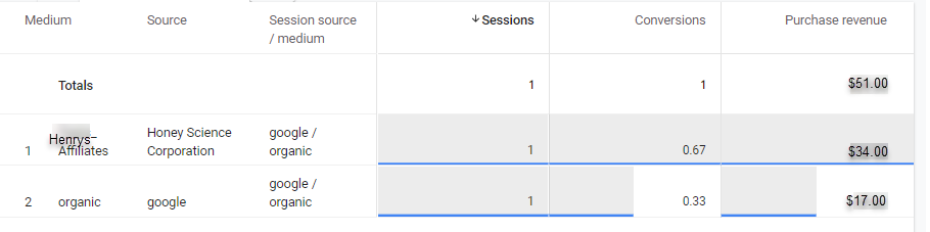
We see different answers here because these dimensions are scoped differently. Session source refers to the source that brought the user to the landing page and started the session. Source (no prefix) is scoped to only conversion events. It is not the same as either the First user source or the Session source.
Remember, in our example, the affiliate link (Honey) was introduced mid-session. So, it was the last source prior to the conversion, and the Source dimension gave the affiliate link most of the credit for the sale. Honey would be nowhere to be found if we used First user source or Session source when we looked at this particular transaction – Honey isn’t what first brought Billy to the site, and isn’t the source that started that session. The link click introducing the affiliate occurred during the session.
The ”Source” dimension is only populated for conversion events and is also AI-based. It will attribute a portion of conversion value to all of the user’s previous known sources or referrers, with weightings that are not publicly available and are always subject to change without notice. In this case, it gave 1/3 of the credit to the previous referrer that actually started the session, but if there were other referrers in the user’s known history, they would also get some credit for the conversion. As such, non-prefixed dimensions are considered Attribution dimensions and are purely meant for understanding conversion attributions, rather than overall site metrics.
Attribution dimensions are used in the Advertising section of standard reports in GA4, which are particularly useful if you want to understand the value of any channel (or campaign, or source/medium) as a touch point in the conversion process. The Attribution paths report is useful for exploring how various touchpoints interact to drive conversions. The Model comparison report in the Advertising section allows you to select Last touch or Data-driven attribution models to compare how powerful different sources are in driving traffic or conversions. If Henry’s Hats looks at this report, they will see the attribution credit divvied out in the same way as we saw in the Exploration report above, as well as other modeled views.
Conclusion
In this way, GA4 can provide a more detailed and nuanced picture of the users’ conversion journeys than GA3 could, particularly when looking at attribution. The key is to understand exactly what each report or dimension means; otherwise, these reports give different answers, and it’s very unclear as to which one is “right”.
GA3 would have only one way of looking at this particular sale. It would have processed the introduction of the affiliate promo code as a new referrer and would have started a new session. The first session would have a source of Google and would start on the landing page and end on the cart page. The second session would start on the cart page and end on the purchase confirmation page, and have a source of Honey Science Corporation. Two distinct sessions, with only the second containing a sale.
If you have been struggling to understand your e-commerce and traffic reporting in GA4, particularly if your site accepts affiliate coupons, we hope this helps!
If you still have questions or data validation needs, contact Confidence Interval today and take control of your analytics data!