
Part 1: Be Sure You Have an Ample Sample
A while back, we asked a customer service rep at one of the well-known A/B testing companies what the proper sample size should be for our customers’ tests. Not satisfied with his answer, we began looking into the issue ourselves. We discovered that sample size is just one of several confusing statistical issues that could be leading marketers to make poor decisions regarding their website optimization.
Over the next few blogs, we’ll take a look at some of the problems that may be affecting your A/B test results, as well as give you tips that you can use to minimize errors and improve the overall accuracy of your tests.
The Issue of Sample Size Is Too Important To Ignore
A lot of marketers are beginning to notice large disparities between purported increases in conversion rates (uplift) from their A/B tests, and their actual, real-world, conversion rates. Despite this, countless marketing “case studies” are released every week that make all sorts of claims about conversion rate increases. To the untrained eye, most of these study results actually seem plausible:
- Adding an FAQ section to the landing page: 11.5% uplift
- Personalized banner ad: 6% uplift
- Replace an image with a video: 12.6% uplift
- Changing testimonial placement: 64.5% uplift
- Emotional picture targeting: 38% uplift
Individually, these don’t seem far-fetched. And making these five simple changes would give you a 132% uplift, right? If that were true, we’d all be rich!
So then why the disparities?
The problem is that most A/B tests are, mathematically speaking, a bunch of poppycock. The tests rely on statistical models that were designed for long-term scientific studies, not short-lived marketing surveys. Statisticians have spent the last couple hundred years ironing all of the kinks out of statistical tests, and they’ve got it – quite literally – down to a science. But most marketers simply don’t dedicate the time needed to perform statistically sound A/B tests.
That’s not to say that marketers are always to blame. They’re part of a high-pressure system that demands they produce winning results in as little time as possible. As is often the case in today’s world, quality gets brushed aside in favor of quantity and the marketers end up leaving a lot of mathematical jetsam in their wake.
There are several statistical concepts that marketers are either completely unaware of, or are forced to ignore in their A/B tests. None of those concepts, though, is more important than the sample size of those tests.
What some companies are saying about sample size
The aforementioned customer service rep told us that a sample size of 500 conversions was enough to confidently make a decision on an A/B test. He’s not alone. A quick Google search turned up countless articles claiming that anywhere from 100 to 2,000 conversions would be a large enough sample size to conclude the test. Some even suggest that sample size doesn’t really matter and you can simply stop the test as soon as the dashboard says it has reached significance. Such statements range anywhere between daft and dead-wrong.
Why all the fuss over sample size?
You don’t need a PhD in inferential statistics to understand why sample size is important. We all know that it’s usually impossible to survey an entire population of people, so we use small samples of that population to make inferences about the larger population as a whole. It makes intuitive sense that a larger sample would more accurately represent the population to which that sample belongs.
Conversely, a small sample will almost never be representative of a larger population. That can become a serious issue if you’re using A/B testing to determine the best course of action for an online business.
Our Simulated Examples
We would have liked to have given you our analysis of some of the real-world A/B test data that we have at our disposal. But, in the spirit of protecting our customers’ data, we instead simulated A/B tests using a random number generator. The results closely mirror those of the commercially available A/B testing platforms, demonstrating the point.
Before we get to those test results, we’ll need to take a quick look at a few of the important properties of a meaningful statistical test and how those properties are negatively affected by undersized samples.
Statistical power is your ability to detect differences
The statistical “power” of an A/B test is the likelihood that you will detect a difference between variant A and variant B, assuming, of course, that a difference actually exists. A high power is always preferred over a low one, and researchers usually set a power of 80% as their minimum. We would read that as “There is an 80% chance that we will correctly detect a true difference between variants.”
Statistical power is directly related to sample size; the larger your sample size, the more powerful your test is. Let’s say we have a coin that we suspect is rigged to land heads-up more often than it lands tails-up. We know that a fair coin would land heads-up roughly 50% of the time, but our experiments show that our coin is landing heads-up 60% of the time. It’s entirely possible that we’re just lucky and our results are due to some random chance, but how do we know for sure?
Take a look at the three graphs below. Each of them represents the statistical power for our coin-flip experiments. The first graph shows an experiment with a sample size of 10 coin flips, the second graph is for 100 coin flips, and the third is for 1000 flips.
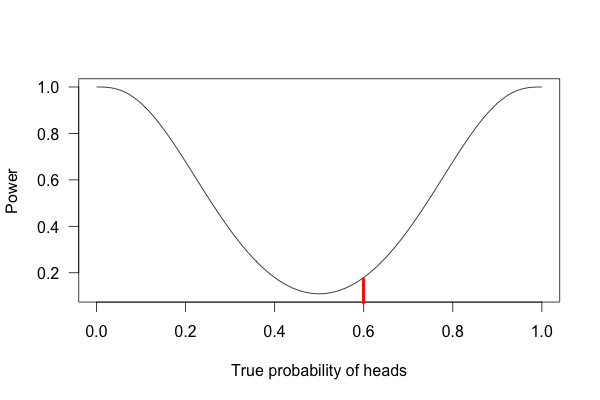
If we follow the red lines up from our 60% point, we can see the power for each of the three experiments. For the above experiment, we flipped the coin 10 times. The resulting power for that experiment is a meager 20%. That means that if we flip a coin 10 times, and it lands heads-up 6 of those times, there’s only a 20% chance that what we’re seeing is the result of our coin actually being rigged (and an 80% chance that we’re not detecting any effect at all).
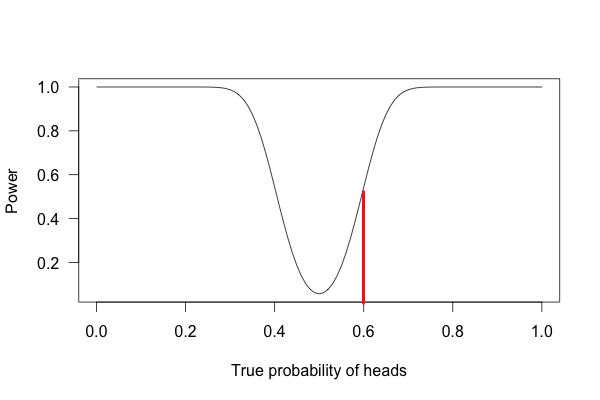
For the second experiment with 100 coin-flips, we see that our power has increased dramatically, but still sits at a modest 50%; not enough to confidently determine anything.
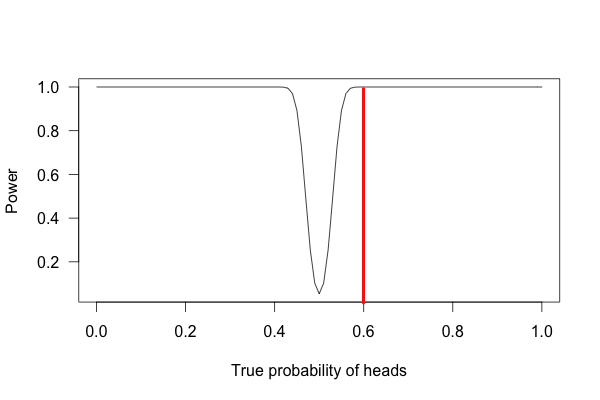
Image Source: Statistics Done Wrong
For the experiment with a thousand flips – 600 of which are heads – we get a power near 100% (it’s technically impossible to have a power of 100%). Meaning that it’s very unlikely that a fair coin will land heads-up 60% of the time after 1000 flips. After this test, we could safely conclude that we have a rigged coin.
Underpowered tests are a big problem within randomized drug trials. It’s incredibly difficult and incredibly expensive to find participants for individual drug studies. Consequently, the tests don’t always have enough data to confidently conclude things like side effect profiles.
Lucky for you, A/B testing isn’t anywhere near as expensive as running a drug trial. However, that doesn’t mean you should be running underpowered tests. A higher conversion count means you can more easily detect differences in conversion rates between your variants. But if your test is underpowered, you may miss those differences entirely.
Margin of error is exactly how it sounds
Most of you have probably come across one article or another on how the public feels about a given politician. There will usually be some attention-grabbing headline like “President Obama’s Approval Rating Hits All-Time Low.” The author will sometimes give the survey’s margin of error somewhere in the story. That particular article notes that the president’s approval rating was at 40% with a margin of error is ± 3%.
The margin of error can be thought of as a test’s accuracy. The smaller the margin, the more accurate the test is. The 3% margin of error in the above linked article means that President Obama’s approval rating in that poll could actually be anywhere between 37% and 43%; a relatively small and acceptable range.
FUN FACT: The range of values determined by the margin of error is called the confidence interval, and that’s where the name of our company comes from!
The table below shows the margins of error for various sample sizes. Note how the margin of error increases as sample size decreases.
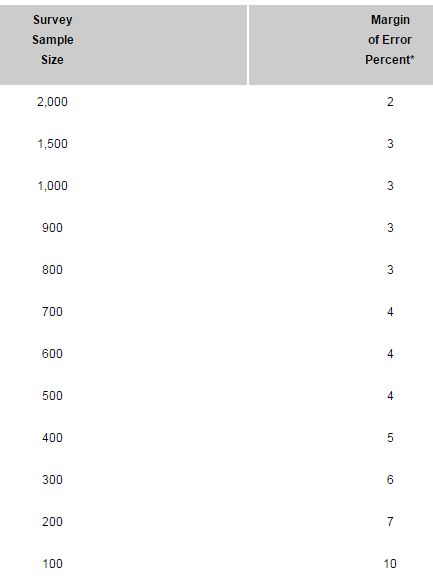
Source: iSixSigma.com
Let’s say you run an A/B test that shows a 12% uplift in conversion rates after 200 conversions. Your margin of error would be ±7%, and your actual conversion rate would be anywhere from 5% to 19%. That may seem like a small range, but it could easily mean the difference between a fiscally sound decision for your company, and a budgetary blunder. If you ran the same test all the way to 2000 conversions, your margin of error would only be ±2%, making your test much more accurate.
Significance isn’t exactly how it sounds
Outside of scientific circles, the word “significant” is used to describe how important something is. But when we talk about a statistical test being significant, we’re saying that the results are likely true.
The significance level of a scientific test is set before the test begins, and scientists have historically set their significance levels at .05 or .01. That means that they are willing to accept that there is a 5% or 1% chance that their test results contain an error. Another way to look at that is if we ran a test 100 times at a 5% significance level, 5 of the tests would likely be false. In short, the lower the significance level, the more legitimate the test results are.
The compliment to significance level is called the confidence level. If the significance level is 1%, then the confidence level is 99%.
Significance level is a major source of confusion for a lot of marketers. First, most all of the commercially available A/B testing platforms give you the confidence level, not the significance level. Second, they usually ditch the term “confidence level” and go with something like “Confidence Index,” or “Certainty Level.” A couple of them even report the confidence level, but then call it the significance level. Confused yet?
Sample size has a big impact on a test’s significance. An A/B test can be reported as “significant” after only a few conversions, but that doesn’t mean it’s actually a statistically significant result. To illustrate this concept, we used an employee’s 8 year old son to run another coin-flipping experiment. We gave him some quarters and told him that they might be trick coins and that it was up to us to test them and find out. He flipped a quarter 10 times for each trial. After bribing the kid with ice cream, we repeated the experiment until we had 10 trials with 10 coin-flips each.
The results surprised even us: 8 out of 10 trials returned “significant” results. Meaning that we observed an unusually high number of heads or an unusually high number of tails in those 8 trials. However, all of the trials taken together produced 52 heads and 48 tails; a statistically insignificant result.
The same concept holds true for A/B testing. You can get significant results all day long with small sample sizes, but those winning results will usually disappear as your sample size becomes larger and more representative of the population. Small sample sizes simply don’t produce enough data to confidently consider a test significant.
How our simulations measured up
We wrote a small macro in Excel and used it to run simulated A/B tests. Just like in a real-world test, each “participant” was randomly assigned to variant A or variant B. We won’t bore you with all the arithmetical nitty-gritty, just know that we used the same statistical tests that are used by the big A/B testing companies.
We determined that we needed 10,000 “visitors” in order to properly run our tests. We then ran several tests using that number and simulated stopping those tests early to illustrate the effect of having undersized samples.
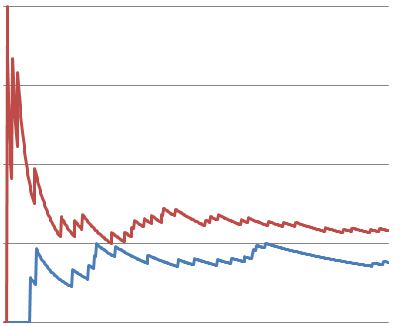
Here’s one of our tests after 500 visitors. Note how the conversion rates start out strongly in favor of variant B (red) and then quickly begin to normalize.
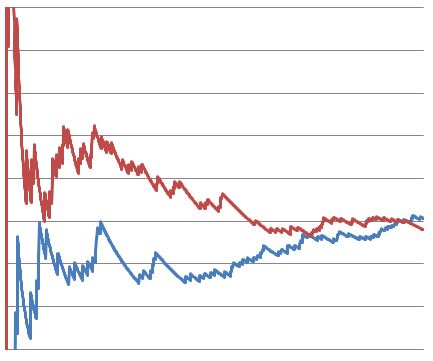
Here’s the same test after 1500 visitors. Notice how the conversion rates actually start to reverse and favor variant A (blue) towards the end of the test.
Finally we have the same test run all the way to 10,000 visitors. By the end of the test, there was no statistically significant difference in conversion rates between variants A and B.
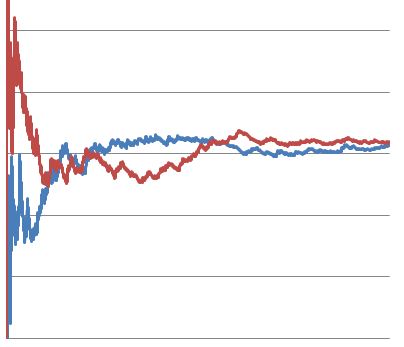
It’s easy to see how marketers might make a poor decision based on the above test. There are several points throughout the test where an untrained analyst would have concluded that one of the variants was superior to the other, even though there was virtually no difference between the two in the end.
What We Learned Throughout This Process
We spent several days researching various topics for this blog. We discovered that a few people are beginning to realize the statistical wool being pulled over our eyes with bad A/B test statistics, but very little is actually being done about it. On the one hand, you have a small group of mathematically-inclined marketers who embrace the computative aspects of A/B testing. On the other hand, you have the larger group of marketers who are simply unable – or unwilling – to take the time to understand these concepts. As much as we’d like to suggest that the two groups find a comfortable middle ground, we just don’t think it’s possible at this time. We feel that marketers shouldn’t be ignoring the maths behind these tests, and should instead take it upon themselves to build a solid foundation in statistics.
Our take on sample size
When it comes to sample size, there is no magic number. Any article or blog author (or customer service rep) that makes claims regarding a one-size-fits-all sample probably doesn’t understand the statistics behind the tests.
One thing is certain: there’s a tradeoff between the length of an A/B test and its legitimacy. A quick test isn’t accurate, and an accurate test isn’t quick. There may be times when all you need to know is whether or not a small change to your website or email program will be a good or a bad change. If that’s the case, it’s not unreasonable to trust a quick A/B test done by one of the available platforms. However, if your company’s bottom-line (or even your job) depends on the results of an A/B test, you should err on the side of caution and run the test with a large sample size.
So then how big should your sample size be?
There are several sample size calculators available to you for free. We reviewed them and found Evan Miller’s calculator to be the most comprehensive and easiest to use. Here’s a quick explanation of the terms used in Evan’s calculator:
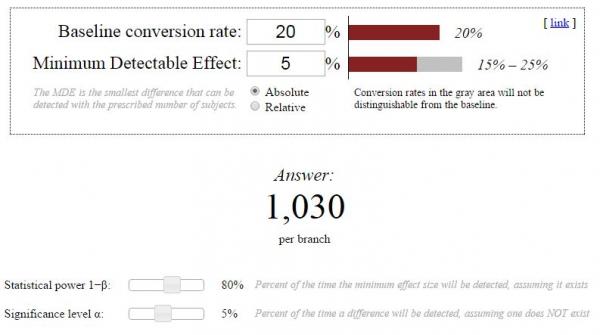
Baseline conversion rate: This is the conversion rate for your control variant (usually called “variant A”). Hopefully you’ve been keeping track of that data. If you don’t have access to your baseline conversion rate, make your best educated guess.
Minimum Detectable Effect (MDE): The MDE is the smallest change you want to be able to detect with your 2nd variant (usually variant B). The smaller the change you want to detect, the bigger your sample size will need to be. Unfortunately, there’s no magic number here either. Your MDE is going to depend on your specific needs.
Absolute/Relative: This selection tells the calculator whether or not you want the effect of variant B to be based on the actual conversion rate (absolute) or the conversion rate in comparison to the baseline conversion rate (relative). Try to think of it in terms of being rich or poor. In some parts of the world, you’d live a comfortable lifestyle making $30k a year. And in other parts, you’d barely be able to survive with that kind of salary. While your salary may be fixed at $30k (absolute), it’s actually worth different amounts in various parts of the country (relative). You’ll want to select relative for most tests.
Statistical Power: This slider lets you determine the power of your test. As previously discussed, a higher power is always better but it requires a larger sample size. Again, this depends on your specific needs, but we recommend keeping it at a minimum of 80%.
Significance Level: This is the level of error you’re willing to accept in your test. As we said earlier, this is usually set at 1% or 5%. You could go as high as 10%, but your results will be much less trustworthy.
Our take on the available A/B testing tools
It’s not our place to sit here and say that all the A/B testing companies are intentionally misleading you. However, it’s hard to imagine that they’re completely unaware of the problems associated with the their testing software. It’s unfortunate that these companies are allowing us all to believe that so many of our tests are winners, when in fact they aren’t.
The testing companies don’t give you bad numbers (at least not that we’re aware of) but they do give you a bad interpretation of those numbers. They lead you to believe that your test is more significant or has a smaller margin of error than it really does.
That being said, the testing platforms can actually serve you well, if they’re used properly. You can use them to collect all your data, but then you should run the calculations and make the interpretations yourself. Time to break out the stats book!
Tips to improve the legitimacy of your A/B tests
If you’ve made it this far, you probably have a vested interest in running valid A/B tests. Here’s a few tips you can use to run tests that produce more reliable, more actionable results.
- Calculate your sample size first and run the test all the way through: In case it’s not clear by now, sample size is too important to ignore. Use Evan’s calculator (see above) to determine what your sample size should be. And whatever you do, DO NOT stop the test until you have reached that benchmark. Unless you’re lucky enough to have a thousand unique visitors to your site everyday, you’ll probably be running your tests for several weeks or even months. Which brings us to the next point…
- Test only the important stuff: Leave button color alone. Proper A/B testing takes way too much time, and that time would be better spent not testing trivial things like button color. Use your A/B tests to tests to gather data on major changes to your site or email campaign.
- Check your numbers: There are a few different significance calculators available for you to use to calculate the significance of your tests AFTER the test is complete. The good people over at abtestguide.com have a fantastic calculator that’s simple to use and easy to understand. Don’t blindly trust the numbers or pretty green checkmarks on your testing dashboard. Always verify!
- Question your results: When you see a company claiming that they increased their conversion rates by 139% simply because they changed one word, all sorts of red flags should pop up in your mind. The same thing should happen if you get similar results in one of your tests. It’s certainly possible to get large uplifts from simple changes, but as the old adage goes, if something seems too good to be true, it probably is. You should always take the time to go back through your tests to make sure you crunched the numbers correctly.