The conversation started the way these things usually do: “The site feels slow.” Recently, a banking launched several site updates. The development team reported a successful deployment and normal performance metrics. The business team had either not conducted thorough user acceptance testing or had accepted developer reassurances that intermittent issues were within normal parameters.
When our QA team flagged performance concerns, we didn’t rely on subjective assessments. We pulled up our automated Core Web Vitals tracking—data we’d been collecting every week since the engagement began—and correlated a significant PageSpeed score degradation with measurable traffic decline during the launch period. Mobile PageSpeed scores had dropped from 26 to 13. Natural search bounce rate spiked from 6% to 14%. The correlation was undeniable.
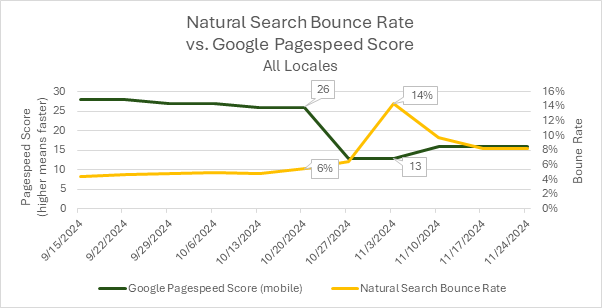
Caption: Example data from the launch period. Bounce Rate was strongly correlated with the site launch date.
This was only possible because we had established baseline metrics before the launch. Without historical data, it would have been our testers saying “it feels slow” versus developers saying “metrics look normal,” with no objective arbiter. Instead, we had charts showing exactly when performance degraded and what the business impact was.
That’s why we now automatically set up Core Web Vitals monitoring for every retainer client—not because we expect problems, but because when problems occur, baseline data transforms speculation into diagnosis.
The Communication Gap Between Business and Technical Teams
One persistent challenge in digital operations is the difficulty of productive conversations between business stakeholders and technical teams when performance issues arise. It’s rarely a matter of competence on either side. The problem is that both groups are working with incomplete information and different frames of reference.
Business teams notice user experience issues—slow page loads, layout shifts, sluggish interactions—but lack the technical vocabulary and measurement tools to quantify what they’re experiencing. Developers have access to technical metrics but often can’t see the cumulative user impact or business consequences of incremental performance degradation. Neither party has visibility into how current performance compares to historical baselines.
This creates a communication gap where legitimate concerns get dismissed as subjective impressions, and actual technical issues go undiagnosed until they become crises. What’s needed is a shared set of objective metrics that both teams can reference, tracked consistently over time, and maintained by someone who speaks both languages.
What Core Web Vitals Actually Measure (And Why Google Cares)
Core Web Vitals are Google’s standardized metrics for measuring user experience quality. They’re not abstract technical measurements—they directly capture what users experience when loading and interacting with a website. More importantly, they’re now ranking factors in Google’s search algorithm, which means poor Core Web Vitals don’t just frustrate users; they also suppress organic traffic.
The three Core Web Vitals that affect search rankings are:
Largest Contentful Paint (LCP) measures loading performance—specifically, how long it takes for the main content of a page to become visible. Google’s threshold is 2.5 seconds or less. This captures whether users are staring at blank screens or placeholder content while waiting for the page to load.
Cumulative Layout Shift (CLS) measures visual stability—whether page elements jump around unexpectedly as the page loads. This is the metric that captures the frustrating experience of trying to click a button only to have it move at the last second because an ad loaded above it. Google’s threshold is 0.1 or less.
Interaction to Next Paint (INP) measures responsiveness—how quickly the page responds when users click buttons, open menus, or fill out forms. Google’s threshold is 200 milliseconds or less. This replaced First Input Delay as a Core Web Vital in March 2024 because it better captures the full experience of page interactivity. INP is a field metric that requires real user interaction data, but lab testing can measure Total Blocking Time (TBT), which correlates strongly with INP performance.
Beyond these three ranking factors, our monitoring captures the two Core Web Vitals measurable in lab testing (LCP and CLS), plus several other metrics that provide diagnostic context:
First Contentful Paint (FCP) measures when any content first appears on screen, providing an early indicator of perceived load speed. Speed Index measures how quickly content is visually displayed during page load, capturing the user’s perception of loading speed better than any single time-to-event metric. Total Blocking Time (TBT) measures how long the page is unresponsive to user input during loading—essentially quantifying how long users have to wait before they can interact with the page. As mentioned above, TBT serves as a lab-based proxy for the INP Core Web Vital.
These metrics are captured using Google’s PageSpeed Insights API, which runs tests in a controlled lab environment. This means the measurements are consistent and comparable over time, unaffected by variations in user devices, network conditions, or geographic location.
How Automated Monitoring Changes the Equation
The difference between having Core Web Vitals data and not having it is the difference between diagnosis and speculation. Without baseline metrics, a performance conversation might sound like this:
Business team: “The site feels slower since the launch.”
Development team: “We’re not seeing any errors in the logs. Performance metrics look normal.”
Business team: “But users are complaining.”
Development team: “We can investigate, but we need more specifics. What pages? What devices?”
Business team: “I’m not sure. It just feels slower.”
With historical Core Web Vitals tracking, the same conversation becomes:
Analytics consultant: “We’re seeing LCP degradation on the homepage—it went from 1.8 seconds to 3.2 seconds starting October 21st. That correlates with a 14% natural search bounce rate spike and matches the launch date. Mobile PageSpeed scores dropped from 26 to 13 during the same period.”
Development team: “Okay, that gives us a specific timeframe and metric to investigate. Let’s look at what changed in that deployment.”
The first conversation ends with everyone frustrated and nothing actionable. The second conversation starts with objective data that focuses troubleshooting efforts.
For our retainer clients, we automatically configure this monitoring during engagement setup. We work with clients to select representative pages—typically the homepage, key landing pages, top content pages, and critical conversion paths. Our tool then tests these pages weekly using the PageSpeed Insights API, capturing the full suite of Core Web Vitals and diagnostic metrics across both desktop and mobile.
The results get exported to a tracking spreadsheet where we can visualize trends over time. This creates a longitudinal dataset that reveals patterns invisible in point-in-time measurements: seasonal performance variations, gradual degradation as content accumulates, sudden drops correlated with code deployments, and the performance impact of third-party scripts or advertising integrations.
What Historical Data Reveals
The real value of continuous monitoring isn’t catching catastrophic failures—those tend to be obvious. It’s catching the subtle degradation that happens gradually or the problems that only affect specific page types or device categories.
In our banking client example, the desktop performance had remained relatively stable. It was the mobile performance that had degraded significantly. Without separate desktop and mobile tracking, that distinction would have been invisible, and troubleshooting would have been much more difficult.
Similarly, we’ve seen cases where only certain page types were affected—article pages performed fine while video pages degraded, or homepage performance remained strong while deeper content pages slowed down. When you’re only spot-checking performance, you miss these patterns.
Historical data also provides context for interpreting current metrics. A PageSpeed score of 45 might sound problematic in isolation, but if that’s consistent with six months of historical performance and hasn’t affected traffic or engagement metrics, it might not warrant immediate attention. Conversely, a score of 65 might seem acceptable, but if it’s down from a historical baseline of 85 and correlates with traffic decline, it’s a red flag.
The Practical Reality: It’s Not Turnkey
We should be clear about what this tool is and isn’t. It’s not a polished dashboard product that clients can log into and explore. It’s an operational tool we maintain for client engagements, and it requires initial setup and ongoing interpretation.
When we configure monitoring for a new client, we work together to select which pages should be tracked. This requires understanding their site architecture, conversion paths, and business priorities. A media company might want to track different page types than an e-commerce site. A lead generation site might prioritize landing page performance, while a content publisher might focus on article load speed.
We also help interpret the results in a business context. A two-second increase in Largest Contentful Paint might be a crisis for one client and a non-issue for another, depending on their competitive landscape, user expectations, and traffic patterns. Our role is to provide both the objective measurement and the expertise to understand what it means for that specific business.
This is fundamentally a consulting service enabled by automation, not a self-service software product. The automation makes it economically feasible to provide continuous monitoring as part of retainer engagements, but the value comes from the expertise in configuration, interpretation, and action.
Why This Matters for Agency Relationships
One subtle benefit of systematic Core Web Vitals monitoring is how it changes the dynamics of agency-client relationships. When performance issues arise, the conversation doesn’t start with blame or defensiveness. It starts with data.
For developers, this is actually protective. Instead of being asked to defend vague accusations that “the site is slow,” they’re given specific metrics, timeframes, and page-level details that make troubleshooting tractable. Good developers appreciate having objective data that helps them isolate problems.
For business stakeholders, it provides visibility into technical performance without requiring them to become technical experts. They can see trends, understand impacts, and have informed conversations about priorities and tradeoffs.
For our role as analytics consultants, it positions us as the neutral third party with the data infrastructure to facilitate productive conversations. We’re not advocating for one team against another—we’re providing the measurement layer that helps everyone make better decisions.
We Set This Up Automatically for Retainer Clients
If you’re working with us on an ongoing analytics engagement, Core Web Vitals monitoring is something we include as part of our standard practice. It’s not sold as a separate service or add-on—it’s part of how we think about comprehensive digital analytics.
The setup is relatively straightforward for us because we’ve systematized it. We work with you to identify key pages, configure the monitoring, establish baseline measurements, and set up the tracking infrastructure. From that point forward, it runs automatically, creating a growing dataset that becomes more valuable over time.
When we’re reviewing monthly analytics together, performance metrics are part of the conversation. If we see anomalies—sudden drops in PageSpeed scores, gradual LCP degradation, CLS spikes on specific page types—we flag them proactively. Sometimes they’re worth immediate investigation, sometimes they’re just context for understanding other metrics, and sometimes they’re early warnings of problems that haven’t yet affected user behavior but will if left unaddressed.
The goal isn’t to create alarm or generate busywork. The goal is to ensure that when performance questions arise—and they always do eventually—we have the historical data ready to answer them. It’s the analytics equivalent of insurance: you hope you never need it urgently, but you’re very glad it’s there when you do.
The Broader Point About Proactive Service
This kind of systematic monitoring reflects a broader philosophy about how analytics consulting should work. The best client relationships aren’t reactive—waiting for problems to be reported and then scrambling to diagnose them. They’re proactive—building the data infrastructure during stable periods so that when questions arise, answers are already available.
Core Web Vitals monitoring is one example. We apply the same thinking to conversion funnel tracking, competitive benchmarking, campaign attribution, and anomaly detection. The common thread is anticipating what questions clients will eventually ask and building the measurement systems to answer them before they’re asked.
This is only feasible when you have ongoing relationships with clients, not project-based engagements. It’s one of the advantages of retainer arrangements—the economics support building infrastructure that pays dividends over months and years, not just during a single project sprint.
If you’re planning a website migration, major redesign, or platform change—or if you’re just wondering whether your site performance is helping or hurting your digital marketing efforts—we can help establish the baseline measurements that make those conversations data-driven rather than speculative.
Contact us to discuss how performance monitoring could fit into your analytics program.
By Misty Johnson · January 12, 2026
← All Posts